THE TRADER’S MINDSET

0 comments
You must keep in mind that even with a tested and profitable system, you could have numerous losses in a row. This is usually referred to as drawdown. Being aware that this can and will even- tually occur can prepare you to control risk and not abandon your trading system when drawdown occurs.

This confidence is an important ingredient in your mindset, one that you must develop in order to be consistently profitable. You are striving for a balanced growth  in  your  trading  equity curve over time. When you see that  steady  balanced  growth, you’ll know you’ve developed the mindset necessary to be a trader.
Acquiring the trader’s mindset takes time and experience and generally occurs when you least expect it. Here’s a partial list of the traits you should develop:


■  Sense of calm when trading

■  Ability  to  focus on  the present reality and not how you would like reality to be

■  Disregarding which way the market breaks or moves

■  The feeling that the money is not the point

■  Always looking to improve skills

■  Open-minded, keeping opinions to a minimum

■  Absence of anger

■  Enjoyment of the process

■  Trading one chosen approach or system

■  No need to control or conquer the market

■  No feeling of being victimized by the markets

■  Taking full responsibility for all trading results.

USD/GBP Head and Shoulder chart pattern analysis

0 comments
I would like to show you the daily chart of
the GBP/USD.
As can be seen in the attached picture, technical analysis shows what looks like a “head and shoulders” Pattern forming, suggesting a strong downward movement in the upcoming month. Marked in blue are the key resistance and support levels - Use them when deciding on a trade direction as it will most likely struggle to break through it and will likely bounce back from it a number of times.

Remember that in terms of Fundamental analysis, we might see extreme volatility on the pair during the US interest rate decision [released on the 23d of September at 18:15pm GMT] and that could very much decide the future of the pair.

Charts Patterns analysis method point

0 comments
A guide to avoid loss making trades

When is a pattern not a pattern?

The easy answer to the question is “when it’s not a pattern”. And that really is the real crux of the issue… Let me explain.

Let’s take a look at one of the most simple patterns in technical analysis, the Double Top (Bottom).

This is the hourly chart of Dollar-Swissie in a run up from the 1.0883 low which found a high at 1.1324. Following this it pulled back lower and then attempted to move back to the high once again. However, it failed just 6 points from that high and then declined quite sharply.

In this process it formed what we call a “Double Top.” This is a classic reversal pattern that through measurements will provide a minimum target in the reversal. Basically, by taking the number of points from the peaks and the intervening corrective low it is then possible to project lower from that trough to generate the minimum target.

In this example the pattern has worked perfectly. What is more, the Rapid RSI below has formed what is a bearish divergence. This is recognized by higher price peaks from the intermediate peak towards the left center of the chart to the eventual 1.1324 high. However, over this period the RSI has not made new highs – but the RSI makes a lower high at the 1.1324 high which represents a slowing in the underlying momentum of the trend.

A combination of this bearish divergence and a subsequent break of a trend support line and failure on the retest of the trend line sets up a stronger reversal which meets the minimum target perfectly.

OK, this is simple, let’s look at another example:

Here we see exactly the same thing happening in the hourly Euro chart. Price has rallied strongly with Rapid RSI forming a high at 1.4751 and then on the pullback lower braches a trend support line. Following the initial decline price rallies back towards the 1.4751 high but fails on the retest of the trend line.

This looks positive. Measuring the points between the twin highs and the intervening trough, from the current price there appears to be 300 points profit.

So if I take a trade of €1mn I can make €30,000 profit and buy a new car…

Well, this is what then happened.
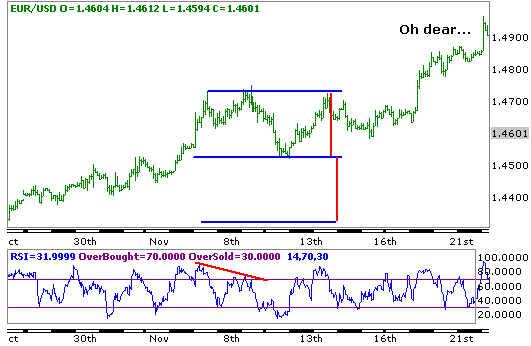
Ah… the Euro actually continued rallying.

So why did the Double Top pattern fail?

As I said, because it wasn’t a double top pattern…

It is vital to understand that a double top only becomes a double top when the intervening trough is breached. (And a double bottom only becomes a double bottom when the intervening peak is breached.)

Clearly this didn’t occur here.

This is very simply explained by examining the definition of an uptrend – which occurs when both highs are moving higher while lows are also moving higher.

If we want to be safe in identifying double tops (or bottoms) we should also satisfy the requirement that the sequence of higher lows is broken – which would be when the intervening trough is breached.

Therefore, avoid this simple error which many still fall into by ensuring that the intervening trough (or peak in a double bottom) is broken to confirm a breakdown of the trend.

Gook luck !

Multi time frame analysis combine with RSI support resistance

0 comments
A technique to improve your trading decisions
Have you ever seen RSI overbought and wonder whether it was the right time to sell? Let’s face it, an overbought reading in a momentum oscillator can merely mean that price is strong and may even turn into an uptrend.
Is it a valid overbought signal? Do you sell? Where do you sell? Where should you place your stop?
Quite often using two charts of different time frames can help. For instance, let us suggest you have seen an overbought reading in the daily chart but there is no bearish divergence. What you can do is look at a shorter time frame chart, a 4-hour or 2-hour chart to see what is happening there an whether a more accurate sell signal can be identified. Let us look at recent example in EURUSD:

Daily EURUSD

Above is the daily chart of EURUSD as it approached 1.3258. Daily Rapid RSI was showing an overbought reading but there was no bearish divergence. From this chart alone we probably couldn’t work out whether there was a selling opportunity or not.

2-hour EURUSD

This second image is the 2-hour chart of EURUSD but here it can be seen that the peak at 1.3258 was accompanied by a bearish divergence in Rapid RSI. We are therefore on warning that a reversal can occur and that the daily overbought reading may well be correct.
Next we have to identify a selling level and in this case it is on the break of the price support line which has touched price four times before it finally breaks and this is where we can place our sell-stop. The money management stop should ideally be placed above the 1.3258 high but if this is too high and would cause a large loss then we can look at placing a stop above the rising trend line. However, do note that is a rising trend line and could mean that your stop needs to be raised to allow a possible retest of the line.
In this case the trade would have been very profitable with a decline down close to the daily pivot support which rests around 1.3050. A take profit order can be placed just above this to exit the position at a tidy profit.

Utilizing a lower time frame chart to identify when Bollinger support/resistance will hold
Following on from the first description of using multiple time frame charts to both strengthen your analysis and enable tighter entry and exit trades, let us take another look at using these in a different example.
Many traders like to use Bollinger Bands to try and identify entry signals. The problem I have always had with them is that they only provide approximate support and resistance which causes problems in knowing where you should enter and where the stops should be placed. Not only that but sometimes they just don’t seem to work at all as a support/resistance tool and the judgment of when they’ll work appears purely subjective.
Take a look at the daily chart of GBPUSD:

Daily chart with Bollinger Bands

In the center of the chart we can see that price has declined to the Bollinger low and on first touch it does bounce only to fall below the lower band and does so on three consecutive days. On the day before the absolute low Rapid RSI moves into the oversold extreme. Does this mean we can buy? Maybe. Sometimes it works and sometimes it doesn’t.
So what should we do?
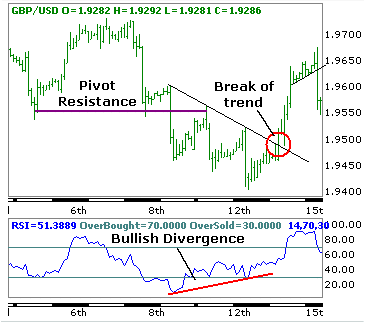
The following chart is the 2 hour chart showing the approach to the low at 1.9400.

Two hour chart

On the left of the chart we can see that price falls below two identical lows and these can then be considered as pivot resistance. We then see the three pushes lower and on the daily chart we know that the Rapid RSI went into an oversold extreme.
Do we buy at that point because is looks like the Rapid RSI on the 2 hour chart is developing a bullish divergence? The answer is “no.” Divergences should only be traded on a break of a pattern. In this case we have an intermediate downtrend line and it is only after the final low that price breaks above the trend line and thus confirms the bullish divergence in Rapid RSI. You will also note that following the break above the trend resistance that price reverses briefly to retest the trend line which provides a second buying opportunity.
Following the break of the trend line which was the day after the daily oversold reading price rallies by 200 points. That’s a good profit… Not only that, by waiting and observing the 2-hour chart you can avoid trying to pick the bottom as suggested in the daily chart.
Remember, it is normally best not to try and pick tops and bottoms as these will often provide losing trades. Waiting patiently for the right signal by fine-tuning the entry on a shorter time frame chart can reduce losing trades and make the final trade a more profitable one.
Good luck !

Free Download Dean Saunders's Blade Forex Strategies

1 comments

Click this link to go to area where you will see direct download link
Free download Dean Saunders Blade Strategies

Download free ebook Amazing Forex System

0 comments

Click this link to go to area where you will see direct download link
Free download Amazing forex system

Andrew Fields and Expert Forex Systems Free Download

1 comments

Click this link to go to area where you will see direct download link
Free download Expert Forex Systems

G7 Forex System by James de Wet free download

4 comments

Download
G7 Forex System

Finance Business Directory - BTS Local
 

Copyright 2008 All Rights Reserved Revolution Two Church theme by Brian Gardner. Converted into Blogger Template by Bloganol