Showing posts with label Forex Articles. Show all posts

How to Make Money in Forex

9 comments

How do you make money in Forex?

There are many strategies available for trading profitably in Forex markets. They take a lot of time and experience to perfect. Many traders lose patience and give up before they even start.

You don’t have to predict the future in order to succeed in Forex trading. What you need to know is how to identify trends and know how to jump into the trend at the precise time. Despite what many brokers will tell you, following the trend does not require complicated technical analysis. Using graphs and charts is fine but identifying Forex concepts and understanding the time-tested systems that have performed well for years will bring you far greater success.

Before undertaking to trade Forex, you must learn the basics of the Forex markets and how they work. By taking the time to study the concepts and trading mechanics of Forex, you will learn to identify the day’s hottest trades and use them to your advantage. You will know how to watch the long term trends and understand the odds involved. Then you can place trades against the odds or with them. No need for complicated technical analysis.

Scams 

Because many Forex brokers are interested in making money off unsuspecting traders, there tends to be an abundance of Forex scams undertaken by fraudulent people. Be wary if there is no listing by a trustworthy regulatory organization and don’t go near that broker. All brokers list a risk disclosure statement but it doesn’t guarantee that your money is safe. Brokers have been known to close up shop overnight and abscond with your money.

Take heed if the opportunities offered by a broker sound too good to be true and stay far away. Keep your eyes open for guarantees of profit numbers that are way higher than industry standard and look askance at promises of making “$2000 per week, every week.”

Never invest all your money. Beginners should start out with a demo account where you can practice for several months with virtual money or you can open a mini account and with a small deposit, make small trades only. Increase the amount of each trade gradually as you gain experience and confidence.

Most online broker websites do warn you that Forex trading contains substantial risks and that you can lose all your money. Sadly, traders overlook this warning and jump into the market with large amounts of cash. Be among those who come out with profits. Be alert and trade carefully.

Daily Elliott Wave Strategy EURUSD - Downside Nesting or Larger Consol

1 comments
Following the strong 3 wave decline from the 1.4940 peak earlier in the year or A wave on the Weekly Perspective, the Euro is settling into a larger B wave consolidation pattern in the 1.3145 to 1.4245 region. With the strong counter trend upside reaction to 1.4245 in a 3 wave format our favored view is for a contracting triangle pattern. Typically the B wave in this formation offers a deep retracement and in this case we have seen a 90 percent pullback to 1.3210. As the minor C wave in this drop has taken a diagonal price pattern, we remain bullish for an upside break of the 1.3610 pivot to allow a C wave swing to the start of the formation at 1.3865 that coincides with a 61.8 percent of the A wave target of 1.3900. This would still further contracting 1.3260 to 1.3900 range trade before the eventual downside break to the weekly 1.2925 target and possible even a test of 1.2625 monthly up channel support. Only a direct loss of 1.3210 would negate the consolidation theory and direct drop to the 1.2925 target.(see below)

EUR-USD ELLIOTT WAVE COUNT ANALYSIS

0 comments
The corrective process from the 1.4045 trend sequence low is progressing well. It has broken the previous high at 1.4250 and the downtrend and is holding a solid updrift. Indeed we are close to completing a 3 wave move with a C=A terminus of 1.4325 (using AB=CD harmonic pattern). However given the 8 day decline from 1.4965 that would look a little too small. In the daily perspective we are looking for a 4 day reaction to the 1.4390-1.4420 area. Thus we must allow for the almost completed 3 wave move to be only A of a larger correction. This leaves the risk marginally higher to 1.4325 before down in either a B wave or possibly trend. A B wave would probably hold 1.4120 for a rebound to the 1.4390-1.4420 target. A direct loss of 1.4045 would confirms the downtrend has resumed. Thus venturing short around 1.4325 should cover both options.
Chart extracted from Elliott Wave Analysis
Failing to pree on after breaks to new highs leaves the Euro vulnerable to a reversal to  1.4160 + possible lower. Over 1.4310 opens way to 1.44xx

Count Elliot Wave EURUSD should reach at least 1.5

2 comments
This is EURUSD pair projection based on Elliott Wave analysis, the level 1.5140 should be reached before current rally pullback. This 1.5140 is also the target of FX strategist of MIGBANK. The screenshot was taken on 29 April and I have entered a LONG position at 1.4829. But 1.5000 is an important psychology level and I believe there are many pending Sell Limit Order ready here so I will put my Take Profit a bit lower: 1.4990, and will consider entering Long again around 1.48 - 1.4750 area afterward.
Currently there is no reliable software, tool, or indicator can count Elliott Wave precisely, everything is subjective. But there is one exception you can rely on, the above analysis is extracted automatically from Elliot Wave Analysis Counting Software.

Gold Bull Charge Tempered by "Muleta" Standoff

0 comments
Special Technical Focus on GOLD.
Gold's phenomenal bull charge which has risen over 468% since 1999 is now starting to unwind after being tempered by a “muleta” standoff. Akin to traditional Spanish bullfighting, a “muleta” or small red cape is raised in order to tire the animal‟s charge and offer a beautiful display of “faena”. The yellow metal has been locked in a critical standoff ever since it carved out its all-time record high at $1431 and is currently showing signs of rolling over. Point & Figure charts highlight a price squeeze within a range between $1430 and $1320 (see Figure 1). A break in either direction has the potential to drive a 20% change in the price of gold. The probabilities are now skewed for an extended downside reaction.
The Trend is your friend, until… Nine-consecutive years of higher reaction highs and lows has elevated gold to a unique stardom within technical analysis record books (see Figure 1. chart insert). With such a high caliber breed of bull, it would only be natural to believe that prices continue to run in a straight line. However, veteran market observers know that such accelerated price moves, no matter how robust, inevitably prove to be unsustainable in the short term. The aftermath of gold‟s previous bull cycle, between 1969 and 1980 (which has an 11-year time pattern that coincidentally mirrors the current secular uptrend that launched in 1999 and peaked in late 2010), acts as an extreme, but noteworthy omen to how market‟s can avalanche from mountainous peaks.
Figure 1. Point and Figure chart illustrates the primary and secondary trend in gold and its current "muleta" standoff between $1430 and $1320. Chart insert (i). Annual candle chart exhibits nine-consecutive years of higher reaction highs & lows. Chart insert (ii). Gold bull-cycles past and present, mirroring 11-year time patterns.
A confluence of important exhaustion signals were generated by Tom Demark‟s TD Sequential indicator across monthly, weekly and daily time fractals (Figure 3). The daily chart highlights that TD Sequential generated Red 13 exhaustion sell signals on two different countdowns within the current multi-month distribution pattern (head & shoulders/triangle). A break below $1320 would confirm the reversal pattern and unlock an extended downside slide in gold.
Further bearish evidence can also be seen on the monthly chart which is currently developing a bearish engulfing candlestick pattern from the all-time record highs, following five consecutive higher reaction highs and lows. A sustained break below $1320 would completes a potential Primary degree impulsive third wave within an Elliott Wave structure. The tendency for cycle alternation favours a sharp corrective fourth wave (opposite to the wave two sideways correction in 2001), which would help develop an important low for 2011. This potentially offers a rare buying opportunity for what is likely to be the most profitable future rise in gold to come.
Figure 2. Time Fractals of Monthly, Weekly and Daily charts showing a confluence of exhaustion signals derived from Tom DeMark's TD Sequential indicator. Monthly chart also has Kase Dev stops overlayed for potential levels to take profits or exit potisions
Conclusion
Gold's primary trend remains intact, but even the strongest of bulls need to stop for a healthy siesta. The “muleta” standoff is likely to leave an important signature on the precious metal‟s roadmap and offer virtuous lessons to investors at large. To profit from gold‟s awe-inspiring rise, we must first learn to respect the nature of its “yin-yang” behavior, just as a “Torero” would respect the beauty and tenacity of a raging bull.
To do this we need to accept the market‟s highly volatile, double-edged, characteristics and enforce disciplined management of risk. Astute trailing stop strategies such as Kase Dev Stops, help protect from sharp trend deviations and can provide short to medium-term profit taking opportunities. Watch for levels at $1240, $1181 and $1111 which are statistically calculated from gold‟s current monthly „true range‟.
Any corrective setbacks are likely to be tentatively cushioned into the $1280-60 confluence zone (primary trend-channel support, 200-day MA, 61.8% Fib retrace) and $1220 (reversal pattern objective), with risk for an overshoot back to the July 2010 lows at $1157. This would be just shy of a 20% correction from the all-time record highs. These moves should provide bulls with adequate re-fuelled energy for another charge onto much higher altitudes. Remember that it will more than likely be gold‟s strongest ascent, as characteristic of the fifth wave structure (the equivalent to Dow‟s primary stage three, irrational exuberance, parabolic “excess”, within a long-term bull market cycle).
Confirmation above $1500-20 (secondary uptrend ceiling), offers moves to $1830 (P&F target), with eventual acceleration to the next psychological glass-ceiling at $2000 and beyond. By this time, further tailwind will likely be offered by significant weakness on the US dollar as its major downtrend resumes and other fiat currencies continue to underperform. Moreover, the weak relative performance of key asset classes and renewed increase in the overall secular uptrend across commodities, driven by rising demand and inelastic supply, will compound ample scope for the “barbaric metal” to stage its “grand finale” bull charge.
If you like this post, get our blog posts emailed directly to your mailbox for free! Join our subscriptions Forex Trading Currency by filling your email.

Things every trader should know

0 comments
Three things every trader should know:
1)Know Your Edge
2)Know Your Risk
3)Know Your Self
Know Your Edge
Obtaining a trading strategy or methodology which has produced a consistent stream of profits over time with acceptable drawdowns has to be the best starting point for the trader. Trading is a game of probabilities, so only taking trades which have a better chance of success than failure provides one with an edge mathematically as well as psychologically.
Know Your Risk
Before entering a trade I would want to know exactly how much trading capital I am risking as a percentage of my account balance. Even the best traders and trading systems suffer drawdown periods where a run of losing trades results in a temporary dip in trading equity, so I would want to limit the amount risked on each trade to 2 percent of my trading capital.
Know Your Self
This may sound like an odd one, but a trader’s character really does comes into play during the trading process. It is very easy to enter into a position, but once established one’s objectivity can become clouded as the human tendency to will the market in your favour comes into play. This becomes more of a factor as the amount of capital at Risk increases and the less sure of one’s Edge. Make sure that your trading style fits your personality, and new risk more capital than comfortable with.

The Recipe for Success: High Probability VS High Profit

0 comments
When it comes to cooking, there is more than one recipe for making delicious spaghetti sauce. When it comes to trading, the same is true—more than one way exists to design a successful trading strategy.

At one time or another, every trader or investor has been taught that the smart thing to do is maintain a 2-to-1 risk-reward ratio or better. This means that for every $100 risked on a trade, the return should be at least $200. For some traders, this type of money management will work, but for others who have seen at least one of their profitable trades reverse violently and eventually be stopped out, this type of risk-reward ratio is idealistic, not realistic.

In fact, trying to maintain a 2-to-1 risk-reward ratio could be hindering many unprofitable traders from turning profitable. Not many people realize that 1-to-1 risk-reward ratios can still yield positive results in the forex market, as long as one has a high-probability trading strategy.

HIGH PROBABILITY VS. HIGH PROFIT

For a 1-to-1 risk-reward ratio to work, one needs a high-probability trading strategy that is successful at least 65 percent to 70 percent of the time. This is not impossible, especially if the trader is an ultra short-term trader who is only looking to make a small amount of pips. However, in order for it to be net positive, more than half of the trades must be winners. For example, if one plans to risk 20 pips on every currency trade, with a return of only 20 pips, 50 percent of the trades would need to hit their profit targets in order for the trader to break even. Sixty percent of the trades would need to hit their profit targets to make 40 pips. If 70 percent of the trades were winners, then the trader would be up 80 pips on every 10 trades.

Here is an example of a high-probability trading strategy that is loosely based on the momentum strategy in the second edition of my book Day Trading the Currency Market. In this strategy, one is simply looking for the price to break the 20-period simple moving average on a closing basis and for the moving average convergence divergence to confirm the direction of the trade in the last five bars (the strategy uses five-minute charts).

More specifically, if the currency pair closes above the moving average, and MACD has crossed from negative to positive within the last five bars, then one goes long the currency pair. If the price closes below the moving average and MACD has crossed from positive to negative within the last five bars, then one goes short the currency pair. Thirty pips are risked on each trade, for a return of 30 pips.

As shown in the following example of the British pound/U.S. dollar (GBP/USD), four out of the five trades were profitable for a net return of 90 pips and an accuracy rate of...80 percent (see Figure 1):
• No. 1, long GU@1.4914 , TP@1.4944 , resulting in +30 pips.
• No. 2, short GU@1.4925, TP@1.4895, resulting in +30 pips.
• No. 3, long GU@1.493, TP@1.496, resulting in +30 pips.
• No. 4, short GU@1.4915, TP@1.4885, resulting in +30 pips.
• No. 5, long GU@1.4905, SL@1.4875, resulting in -30 pips.

With a high-profit trading strategy on the other hand, the success rate can be far lower as long as the risk-reward ratio is high. If one has a trading strategy that risks 50 pips for a return of 150 pips on every currency trade, that trader would only need to be successful 30 percent of the time to be net positive. In other words, if seven out of 10 trades were losers and three were winners, the net return would still be 100 pips.

A moving average crossover strategy is typically a high-profit but low-probability trading strategy. Figure 2 is an example of a strategy that is based on a 10- and 20-hour simple moving average crossover. In this strategy, a trader goes long the currency pair when the 10-hour SMA crosses above the 20-hour SMA. The trade remains open until the currency pair breaks the 20-hour SMA. For a short trade, the guidelines are reversed. The currency pair is sold when the 10-hour SMA crosses below the 20-hour SMA; the exit rule remains the same.

As seen in the following example of the Australian dollar/U.S. dollar (AUD/USD), four out of the five trades were unprofitable for an accuracy rate of only 20 percent, but the net return was still 25 pips (see Figure 2):


• Trade No. 1, short AUD/USD: Enter at 0.6465, exit at 0.6485, resulting in -20 pips. 

• Trade No. 2, long AUD/USD: Enter at 0.653, exit at 0.647, resulting in -60 pips.
• Trade No. 3, short AUD/USD: Enter at 0.647, exit at 0.6495, resulting in -25 pips.
• Trade No. 4, long AUD/USD: Enter at 0.652, exit at 0.647, resulting in -50 pips.
• Trade No. 5, short AUD/USD: Enter at 0.638, exit at 0.62, resulting in +180 pips.

The difference between a high-probability and a high-profit trading strategy is that one focuses on small, consistent wins, while the other swings for the fences. Both can yield positive results in their own right, but swinging for the fences is the most common way to trade and may also be the reason many novice traders have a tough time staying alive in the currency market. With a high-profit trade, which is characteristic of picking tops and bottoms, one may need to be able to survive several misses before one hits the big winner.

Unsurprisingly, high-probability trading is usually synonymous with shorter-term trading, while high-profit trading usually applies to longer-term trades.

Of course everyone hopes to find a trading strategy that has both a high probability and high profit, but doing so may be as difficult as finding the holy grail.

TWO-LOT METHOD

One way to increase the probability of winning trades is to follow the two-lot method that I use. In 2008, 80 out of the 103 trades were winners, for an accuracy rate of approximately 78 percent. Each trade always has a short target and a long target, which means that I trade in multiples of two. The first target is usually easily achievable, while the long target is two to three times the risk. I always trail the stop as the trade progresses to lock in profits because my trading motto is never let a winner turn into a loser. The trades are always based on a combination of fundamental and technical analysis.

By trading more than two lots, a trader exposes oneself to double the risk because if his or her stop is 50 pips away from the entry, for example, and he or she is stopped out on two lots, the real loss is 100 pips. This is why it is absolutely necessary to make sure that a trader is confident in his or her high-probability trading strategy. If one is relatively certain that he or she can make 10 pips a day for example, then the trader should stick with that target and just adjust the trading size.

TWO TRADERS, ONE RESULT

The type of trading strategy that one has is just as important as the trade management used. In the currency market, technical analysis is hands down the most popular way to analyze currencies. Both new and seasoned traders will spend the majority of their time looking at chart patterns, drawing Fibonacci levels, counting Elliott waves or creating their own combination of indicators with the ultimate goal of developing a trading strategy that gives the perfect entry signal.

Based on my experience, however, the exit is just as important as the entry. A few years ago, I remember talking to Rob Booker, a fellow currency trader, about the importance of entries and exits and which is more important. Booker told me that posing that question was like asking a pilot which is more important: the take off or landing. I am sure that almost anyone who has ever been on a plane would agree that both are important. That is why every single one of my trading strategies uses the two-lot method.

While working at JPMorgan Chase, I once traded alongside two extremely talented FX traders. They went long and short the EUR/USD at the same time and, interestingly enough, both ended up making money. The trader who went long euros traded off of five-minute charts and held his position for no more than 20 minutes, while the trader who went short euros traded from one-hour charts and held his position for four hours. The reason both traders were able to make money, even though they had conflicting positions, is because of trade management.

I strongly believe that the management of the trade is critical to successful trading, regardless of whether one practices high-probability or high-profit trading. Traders often lament the many times they should have locked in profits or moved their stops.

As in cooking, there is always more than one recipe for trading success, and if traders are frustrated with trying to adhere to a 2-to-1 risk-reward ratio, high-probability trading may be a better method for them.

If you like this post, jump in our subscriptions Forex Trading Currency by filling your email
and get the Market Watch indicator bonus instantly at the bottom of the confirmation email!
Author Kathy Lien is an internationally published author and the director of currency research at FX360.com and GFT Forex. The second edition of her book Day Trading and Swing Trading the Currency Market was released in Dec 2008.

Engulfing Candlestick Chart confirmed by RSI Indicators

0 comments
FX instructor Richard Krivo has nicely identified how indicator RSI supported by a Engulfing Candlestick pattern can increase the successful probability of your trade.
The rule is simple: For Short Trade, wait until the RSI is above 70 zone and then look for a bearish engulfing candle to close with the RSI closing out of that overbought zone, and/or RSI establishing lower high. Apply conversely for Long Trade.
Look at the screenshot I just prepared today 24 Sept 2010, you will understand, clear and simple. Today we have a good set up to enter Short EurGbp, Elliot Wave Theory support this trade as well, the pink arrows indicate we are going into the final Wave (5th Wave) with target is somewhere around 0.75
(Click on the picture to zoom in)
Screenshot taken on 24 Sept 2010, a good set up to enter Short Sell EurGbp

 ... and why am I picking this 0.75 target, look at the AB=CD rule on  decending triangle on weekly set up on the left,... AB=CD pattern is one among Harmonic Patterns which is used widely in Technical analysis nowadays due to it's high successful rate. For a historical rate statistic, read the Best Harmonic Pattern.
If you like this post, subscribe to my blog to receive further news as well as free indicators/robot instantly, feel free to leave a comment if you have idea/enquiry.

Best Harmonic Chart Pattern Crab

0 comments
Please kindly be informed that this is not  Butterfly, Gartley, Bat Patterns although it  looks similar. The Crab is a Harmonic pattern  discovered by Scott Carney in 2000. It is one  of the most precise of all the Harmonic  patterns. Check out this study summary, it  was conducted on 15+M timeframe and  include both bullish and bearish patterns. The  Harmonic Chart Pattern Crab is the only one  which has over 93% of accuracy which is  really great, thing is you need to pay  attention to its Fibonacci ratios to distinguish  it with other Harmony Chart Patterns.
The critical aspect of this pattern is the tight Potential Reversal Zone created by the 1.618 of the XA leg and an extreme (2.24, 2.618, 3.14, 3.618) projection of the BC leg. The pattern requires a very small stop loss and usually provides an almost exact reversal in the Potential Reversal Zone.

 The Fibonacci levels to be applied in Harmonic Chart Pattern Crab :

Crab Ratios
0.382/0.382/1.618
0.382/0.382/2.000
0.382/0.382/2.240
0.382/0.382/2.618
0.382/0.382/3.140
0.382/0.382/3.618
0.382/0.447/1.618
0.382/0.447/2.000
0.382/0.447/2.240
0.382/0.447/2.618
0.382/0.447/3.140
0.382/0.447/3.618
0.382/0.500/1.618
0.382/0.500/2.000
0.382/0.500/2.240
0.382/0.500/2.618
0.382/0.500/3.140
0.382/0.500/3.618
0.382/0.618/1.618
0.382/0.618/2.000
0.382/0.618/2.240
0.382/0.618/2.618
0.382/0.618/3.140
0.382/0.618/3.618
0.382/0.707/1.618
0.382/0.707/2.000
Crab Ratios
0.382/0.707/2.240
0.382/0.707/2.618
0.382/0.707/3.140
0.382/0.707/3.618
0.382/0.786/1.618
0.382/0.786/2.000
0.382/0.786/2.240
0.382/0.786/2.618
0.382/0.786/3.140
0.382/0.786/3.618
0.382/0.886/1.618
0.382/0.886/2.000
0.382/0.886/2.240
0.382/0.886/2.618
0.382/0.886/3.140
0.382/0.886/3.618
0.447/0.382/1.618
0.447/0.382/2.000
0.447/0.382/2.240
0.447/0.382/2.618
0.447/0.382/3.140
0.447/0.382/3.618
0.447/0.447/1.618
0.447/0.447/2.000
0.447/0.447/2.240
0.447/0.707/2.240
 Crab Ratios                              
0.500/0.382/3.618
0.500/0.447/3.618
0.500/0.500/3.618
0.500/0.618/3.618
0.500/0.707/3.618
0.500/0.786/3.140
0.500/0.786/3.618
0.500/0.886/3.140
0.500/0.886/3.618
0.618/0.382/3.618
0.618/0.447/3.618
0.618/0.500/3.140
0.618/0.707/3.140
0.618/0.707/3.618
0.618/0.786/2.618
0.618/0.786/3.140
0.618/0.786/3.618
0.618/0.886/2.240
0.618/0.886/2.618
0.618/0.886/3.140
0.886/0.382/2.618
0.886/0.382/3.140
0.886/0.382/3.618
0.886/0.447/2.240
0.886/0.447/2.618
0.886/0.447/3.140


Example : Bullish Harmonic Chart Pattern Crab EUR/JPY, 15 min

Example : Bearish Harmonic Chart Pattern Crab EUR/GBP, 15 min
The good point here is you don't have to wait and check for the pattern, it is really time consuming. With the power of technology, we can have the computer do it, it will tell us what the pattern is and draw it out, you can buy such Harmonic pattern indicator for a cheap price.

NFP Non Farm Payrolls News Strategy

0 comments
With US Non-Farm Payrolls, pre-release price action for EUR/USD has been choppy as one would expect. Typically this key data release produces a substantial increase in volatility as fundamentally driven traders who are either lightly positioned or have not yet committed to the market jump in after the data release at 14.30 CET. 
Using EUR/USD as my trading vehicle, I believe that the best way to approach these ‘big news’ days is to wait until after the release of the data rather than taking a position and holding it over the release. What often happens is once the data is released markets often see a knee-jerk reaction as fundamentally-driven traders take a position, particularly if the number is significantly stronger or weaker than the market consensus. However, perversely as it may seem, the markets have a habit of seeing a very powerful movement in the OPPOSITE direction to the initial post-release movement, much to the frustration of those who have taken a position based on the data.  To take advantage of just such a move, I like to follow this three step process.
1) Just prior to the release, I record the price of EUR/USD. This point will be known as the ‘news origin price’ and will be my entry price should the market generate a ‘significant’ movement after the release.   
2) I then calculate price levels which if hit would constitute a ‘significant’ movement due to the news which would tell me that new money is being committed to the market. I would say that any movement which sees the expansion of the global session range by at least 50% is ‘significant’, particularly if it also breaches the yesterday’s high or low in the process.  
3) I then wait for the release. If any of the threshold levels outlined above are hit (give or take a few pips) I will look to enter a position in the opposite direction if and only IF the ‘news origin price’ is seen again during the global session. If the market returns to this level having made a ‘significant’ post-release move outlined above, then all of the news-driven traders will suddenly find themselves underwater and it is they who will chase the price higher or lower in stop-loss related buying or selling. If the trade is triggered, I will place a protective stop-loss the other side of the day’s range so far looking to trail it as the trade (hopefully) moves into profit.
As to targets, this naturally depends on one’s timeframe but I would stress that a move of this nature is often good for a 2 to 1 or 3 to 1 reward to risk ratio, if not by the U.S. close then certainly over subsequent days. If the trade is triggered today, I will look to exit at 3 separate levels (PT1, PT2, and PT3) which I will provide if the trade is triggered. If the first profit target (PT1) is hit, I will move I will my stop to breakeven, presenting a near risk-free trade. I hold the trade until either the stop level is hit all of the profit objectives are met, or at 21.00 GMT on Wednesday.

EVERY TRADE WILL BE A WINNER

0 comments
Sorry, I missed the word "NOT" at the beginning of this post title ...

Even the best trading systems will only be right about 60% of the time. So for every 10 trades, you will lose an average of four times. Even trading systems or certain trading setups with higher rates of return nearing 80% usually fall back to a more realistic 60% return when actually traded. This is because the rates of return on most systems tend to regress to the mean.
If you’re losing 40% of the time, you need to control risk. You can do so by implementing stops and controlling trade size. You never really know which trades will be successful, and as a result, you must control risk on every trade, regard- less of how profitable you think the trade will be. If you end up with more winning trades than losing ones, you can do very well with a 60% win to loss ratio. In fact, with effective risk control, you can sustain multiple losses without devasta- tion to your trading account and emotions.
By not controlling risk and by using improper trade sizes, however, traders can go broke in no time. It usually happens like this: They begin trading, get five losses in a row, don’t use proper trade sizes, and don’t cut their losses soon enough. After five substantial losses in a row, those traders do not have enough capital to continue. And it can happen that quickly.

THE TRADER’S MINDSET

0 comments
You must keep in mind that even with a tested and profitable system, you could have numerous losses in a row. This is usually referred to as drawdown. Being aware that this can and will even- tually occur can prepare you to control risk and not abandon your trading system when drawdown occurs.

This confidence is an important ingredient in your mindset, one that you must develop in order to be consistently profitable. You are striving for a balanced growth  in  your  trading  equity curve over time. When you see that  steady  balanced  growth, you’ll know you’ve developed the mindset necessary to be a trader.
Acquiring the trader’s mindset takes time and experience and generally occurs when you least expect it. Here’s a partial list of the traits you should develop:


■  Sense of calm when trading

■  Ability  to  focus on  the present reality and not how you would like reality to be

■  Disregarding which way the market breaks or moves

■  The feeling that the money is not the point

■  Always looking to improve skills

■  Open-minded, keeping opinions to a minimum

■  Absence of anger

■  Enjoyment of the process

■  Trading one chosen approach or system

■  No need to control or conquer the market

■  No feeling of being victimized by the markets

■  Taking full responsibility for all trading results.

USD/GBP Head and Shoulder chart pattern analysis

0 comments
I would like to show you the daily chart of
the GBP/USD.
As can be seen in the attached picture, technical analysis shows what looks like a “head and shoulders” Pattern forming, suggesting a strong downward movement in the upcoming month. Marked in blue are the key resistance and support levels - Use them when deciding on a trade direction as it will most likely struggle to break through it and will likely bounce back from it a number of times.

Remember that in terms of Fundamental analysis, we might see extreme volatility on the pair during the US interest rate decision [released on the 23d of September at 18:15pm GMT] and that could very much decide the future of the pair.

Charts Patterns analysis method point

0 comments
A guide to avoid loss making trades

When is a pattern not a pattern?

The easy answer to the question is “when it’s not a pattern”. And that really is the real crux of the issue… Let me explain.

Let’s take a look at one of the most simple patterns in technical analysis, the Double Top (Bottom).

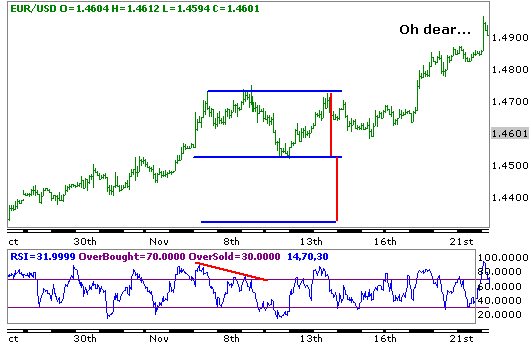
This is the hourly chart of Dollar-Swissie in a run up from the 1.0883 low which found a high at 1.1324. Following this it pulled back lower and then attempted to move back to the high once again. However, it failed just 6 points from that high and then declined quite sharply.

In this process it formed what we call a “Double Top.” This is a classic reversal pattern that through measurements will provide a minimum target in the reversal. Basically, by taking the number of points from the peaks and the intervening corrective low it is then possible to project lower from that trough to generate the minimum target.

In this example the pattern has worked perfectly. What is more, the Rapid RSI below has formed what is a bearish divergence. This is recognized by higher price peaks from the intermediate peak towards the left center of the chart to the eventual 1.1324 high. However, over this period the RSI has not made new highs – but the RSI makes a lower high at the 1.1324 high which represents a slowing in the underlying momentum of the trend.

A combination of this bearish divergence and a subsequent break of a trend support line and failure on the retest of the trend line sets up a stronger reversal which meets the minimum target perfectly.

OK, this is simple, let’s look at another example:

Here we see exactly the same thing happening in the hourly Euro chart. Price has rallied strongly with Rapid RSI forming a high at 1.4751 and then on the pullback lower braches a trend support line. Following the initial decline price rallies back towards the 1.4751 high but fails on the retest of the trend line.

This looks positive. Measuring the points between the twin highs and the intervening trough, from the current price there appears to be 300 points profit.

So if I take a trade of €1mn I can make €30,000 profit and buy a new car…

Well, this is what then happened.

Ah… the Euro actually continued rallying.

So why did the Double Top pattern fail?

As I said, because it wasn’t a double top pattern…

It is vital to understand that a double top only becomes a double top when the intervening trough is breached. (And a double bottom only becomes a double bottom when the intervening peak is breached.)

Clearly this didn’t occur here.

This is very simply explained by examining the definition of an uptrend – which occurs when both highs are moving higher while lows are also moving higher.

If we want to be safe in identifying double tops (or bottoms) we should also satisfy the requirement that the sequence of higher lows is broken – which would be when the intervening trough is breached.

Therefore, avoid this simple error which many still fall into by ensuring that the intervening trough (or peak in a double bottom) is broken to confirm a breakdown of the trend.

Gook luck !

Multi time frame analysis combine with RSI support resistance

0 comments
A technique to improve your trading decisions
Have you ever seen RSI overbought and wonder whether it was the right time to sell? Let’s face it, an overbought reading in a momentum oscillator can merely mean that price is strong and may even turn into an uptrend.
Is it a valid overbought signal? Do you sell? Where do you sell? Where should you place your stop?
Quite often using two charts of different time frames can help. For instance, let us suggest you have seen an overbought reading in the daily chart but there is no bearish divergence. What you can do is look at a shorter time frame chart, a 4-hour or 2-hour chart to see what is happening there an whether a more accurate sell signal can be identified. Let us look at recent example in EURUSD:

Daily EURUSD

Above is the daily chart of EURUSD as it approached 1.3258. Daily Rapid RSI was showing an overbought reading but there was no bearish divergence. From this chart alone we probably couldn’t work out whether there was a selling opportunity or not.

2-hour EURUSD

This second image is the 2-hour chart of EURUSD but here it can be seen that the peak at 1.3258 was accompanied by a bearish divergence in Rapid RSI. We are therefore on warning that a reversal can occur and that the daily overbought reading may well be correct.
Next we have to identify a selling level and in this case it is on the break of the price support line which has touched price four times before it finally breaks and this is where we can place our sell-stop. The money management stop should ideally be placed above the 1.3258 high but if this is too high and would cause a large loss then we can look at placing a stop above the rising trend line. However, do note that is a rising trend line and could mean that your stop needs to be raised to allow a possible retest of the line.
In this case the trade would have been very profitable with a decline down close to the daily pivot support which rests around 1.3050. A take profit order can be placed just above this to exit the position at a tidy profit.

Utilizing a lower time frame chart to identify when Bollinger support/resistance will hold
Following on from the first description of using multiple time frame charts to both strengthen your analysis and enable tighter entry and exit trades, let us take another look at using these in a different example.
Many traders like to use Bollinger Bands to try and identify entry signals. The problem I have always had with them is that they only provide approximate support and resistance which causes problems in knowing where you should enter and where the stops should be placed. Not only that but sometimes they just don’t seem to work at all as a support/resistance tool and the judgment of when they’ll work appears purely subjective.
Take a look at the daily chart of GBPUSD:

Daily chart with Bollinger Bands

In the center of the chart we can see that price has declined to the Bollinger low and on first touch it does bounce only to fall below the lower band and does so on three consecutive days. On the day before the absolute low Rapid RSI moves into the oversold extreme. Does this mean we can buy? Maybe. Sometimes it works and sometimes it doesn’t.
So what should we do?
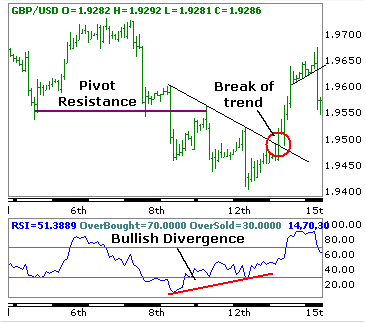
The following chart is the 2 hour chart showing the approach to the low at 1.9400.

Two hour chart

On the left of the chart we can see that price falls below two identical lows and these can then be considered as pivot resistance. We then see the three pushes lower and on the daily chart we know that the Rapid RSI went into an oversold extreme.
Do we buy at that point because is looks like the Rapid RSI on the 2 hour chart is developing a bullish divergence? The answer is “no.” Divergences should only be traded on a break of a pattern. In this case we have an intermediate downtrend line and it is only after the final low that price breaks above the trend line and thus confirms the bullish divergence in Rapid RSI. You will also note that following the break above the trend resistance that price reverses briefly to retest the trend line which provides a second buying opportunity.
Following the break of the trend line which was the day after the daily oversold reading price rallies by 200 points. That’s a good profit… Not only that, by waiting and observing the 2-hour chart you can avoid trying to pick the bottom as suggested in the daily chart.
Remember, it is normally best not to try and pick tops and bottoms as these will often provide losing trades. Waiting patiently for the right signal by fine-tuning the entry on a shorter time frame chart can reduce losing trades and make the final trade a more profitable one.
Good luck !

Trend Identification Bollinger Bands

0 comments
Bollinger Bands basically plot standard deviations above and below a moving average. They were developed in the early 1980sby John Bollinger and are typically used to determine volatility. Here, however, I like to use Bollinger Bands to help me gauge a trend.

In the chart below, we plotted a set of standard Bollinger Bands using the settings 20,2 (which mean two standard deviations away from the 20-day moving average) and then added a set of 20,1 Bollinger Bands (one standard deviation away from the 20-day moving average). This helps us to create our buy zone and sell zone.

Typically, when an uptrend in a currency pair is very strong, it will remain in the buy zone, the zone between the upper Bollinger Band of two standard deviations and the upper Bollinger Band of one standard deviation, for some time. When the downtrend is very strong, the currency pair will remain within in the sell zone, the zone between the lower Bollinger Band of two standard devia- tions and the lower Bollinger Band of one standard deviation. If the currency pair closes below the buy zone or above the sell zone, we say that it has entered the range trading zone.

Bollinger Bands are great tools to use to help determine when a currency pair enters or exits a trend. For those traders who like to pick tops and bottoms, a good way to do so is to wait for the currency pair to exit the buy or sell zones.

Smash Through The Forex Lies

1 comments
Hello Forex Traders !!!

No doubt about it...
Forex trading can bring you a VERY profitable lifestyle.

Once you have systems down and implement methods you know work every single time, there's nothing to stop you from building an absolute fortune.

And you can do that trading from home.
So why do so many traders do nothing but lose all of their hard earned cash?

Simple... they're given BAD information.

Just look around. Everywhere you see marketers who know nothing about trading Forex in the real world pushing their flimsy systems.

Unsurprisingly, they aren't worth a damn.

What every rookie trader needs is a guide or a mentor who knows what the hell they're doing.

I traded at the very top of my game for an astonishing 27+ years.
Let's just say I knows every trick in the book.

Wouldn't you like to have those tricks, techniques and methods in YOUR arsenal?

Do you think that would give you an edge on the competition?
You bet it would.

These aren't your usual Forex methods...

To your success,
Forex Trading Currency

P.S : For those who want to know more about Forex then this Ebook is a must to have manual for all Forex Traders ( Detailed explaination for the most currently used Technical Analysis indicators & fundamental explaination for the most effective economic data on the prevailing markets )
Finance Business Directory - BTS Local
 

Copyright 2008 All Rights Reserved Revolution Two Church theme by Brian Gardner. Converted into Blogger Template by Bloganol